Market Overview Graph
The Market Overview Graph shows an overall long-term historical view of the market based upon last traded price. This enables you to see at a glance the price history for either the entire market, or just those selections you specify. By default the Market Overview Graph is switched off. You can enable by selecting Market Overview Graph from the Main Info Bar Menu. To switch whether a selection displays on the graph, click on its name in the legend. To change the colour of a selection, click on its colour in the legend.


By right clicking anywhere in the window it brings up the various options for the Market Overview Graph.

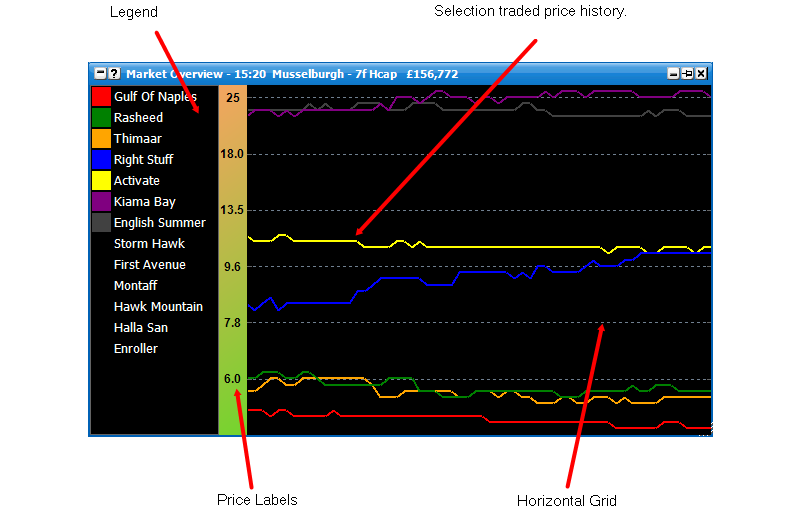
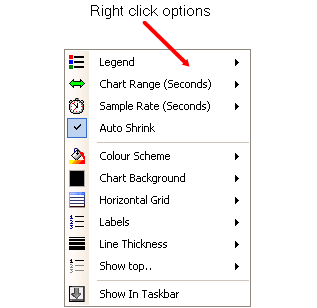
  • Legend - Various settings for configuring the Legend.

    • Location - Allows you to change the location of the Legend relative to the graph to either Left, Right, Top, Bottom or Off. {NB When the Legend is off, runner configuration can be altered via additional options in the right click menu.}

    • Sort Direction - When you first open the market, the runners are sorted by last traded price. Changing this value will determine the display order in the Legend.

    • Font Size - The font size of the selection names.

    • Background Colour - Sets the background colour of the Legend.

    • Text Colour - Sets the text colour of the Legend.

  • Chart Range (Seconds) - Sets the time period in seconds that you wish the chart to cover.

  • Sample Rate (Seconds) - Sets the rate at which the chart is updated. By default this is 1 second, which is adequate for most set-ups.
  • Warning: The charts are very processor intensive. Should you turn the refresh rate up too much on some lower spec systems, this may impact application responsiveness.

  • Auto Shrink - When checked this will cause the graphs Y Axis to auto shrink to the information contained within.

  • Colour Scheme - Allows you to set the chart to a factory set colour scheme.

  • Chart Background - Allows you to set the colours & gradient for the chart background.

  • Outer Background - Should your Price Labels be outside of the graph, this allows you to set the colours & gradient for the labels background.

  • Horizontal Grid - Options for the Y Axis grid lines

    • Colour - Grid line colour.

    • Maximum Lines - Maximum grid lines to show on the graph.

    • Line Type - Off, Light Dash, Heavy Dash, Solid.

  • Labels - Options for the Y-Axis Labels

    • Colour - Label text colour.

    • Location - Which side of the chart the labels display. Off, Left, Right or Both.

    • Font Size - The font size of the labels.

    • Font Style - Bold / Regular / Itallic

    • Labels Inside - Set whether the labels display inside or outside the graph.

  • Line Thickness - The thickness in pixels of the selection lines on the chart.

  • Show Top.. - Show only the top n selections in the chart. As well as adjusting the current market, when set future markets will open based on this setting.

  • Various Runners / Selections - When the legend is switched off, the selections will appear in the menu allowing you to set its colour / activity on the graph.